
Digital design services |
||
Kessler Associates blog: Working with arrays in Excel |
||
|
Start |
||
|
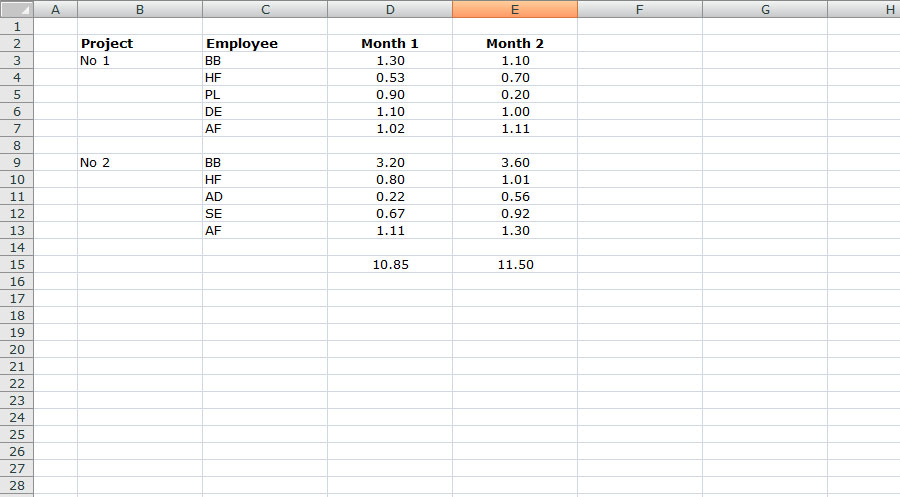
Excel spreadsheets can perform just about any calculation of your figures when you can think of. Actually working out how to achieve those calculations is the tricky part. One recent example was a request to be able to show a combined total for several instances of the same name across an Excel spreadsheet. Each instance was marked by the initials of an employee, and each employee had twenty four separate amounts shown against each entry, recording their monthly work input across two calender years. The image below shows a much-simplified form of this Excel spreadsheet, with only two months of input figures per employee, and complex formatting used to clearly delineate separate segments removed (the finished spreadsheet was a lot prettier!).
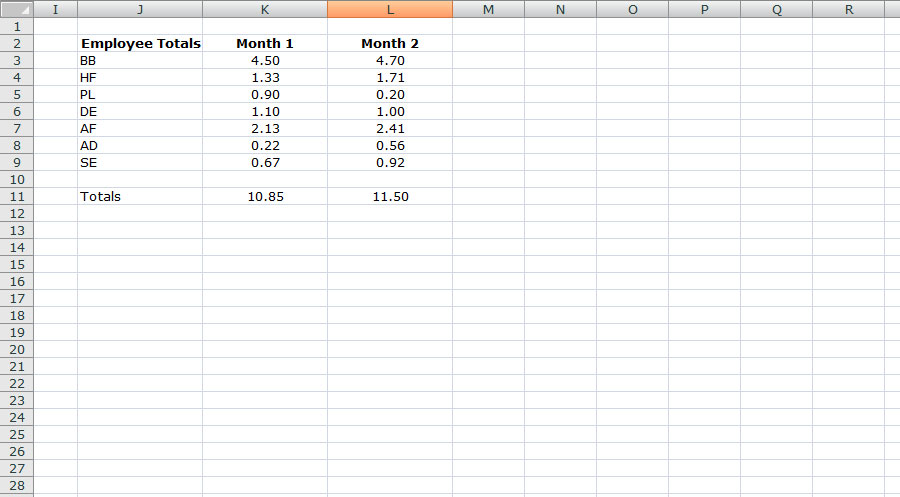
There are two projects. Each project has a number of employees working on it, but not always the same employees. Three employees are working on both projects, meaning that they have to split their time between projects, and may well end up working more. In order to monitor that, a figure is needed to show the total input time for each employee and for each month. Arrays in Excel spreadsheets are complex formulae which allow you to set conditions. In this example, the formula needs to check each set of initials and, when it finds the right initials, it needs to provide a total input time for Month 1 and another for Month 2 (and the original project involved twenty-four months!). After a lot of work, the results showed that, for example, BB had a total input time of 4.50 for Month 1 and 4.70 for Month 2 - far above everyone else and certainly too much to be sustainable. AF was also working across both projects, but came in at a much more reasonable 2.13 and 2.41. SE was only working on one project, with 0.67 and 0.92, but this was due to working part-time.
A great deal of very useful information can be gleaned from using arrays in Excel spreadsheets. Much of it (in this example, at least) is highly useful for managers who need to work out the workload to assign to each employee, but a similar process could be used to ascertain how many exports of whelks are heading to Belgium and how many mussels are heading to Japan on a monthly (weekly, daily) basis. The Belgians are noted for their love of mussels, so the consolidated figures may show that they need to be better attracted towards your exports of mussels. In fact, this process could be applied to just about any consolidated figures you may need, making it highly flexible. And to save you the trouble of working out the formulae - and this is quite a task on its own - we've done the hard work for you. To have your figures working harder for you in Excel, get in touch with Kessler Associates today. Whatever you need, we have the solution. Return to the blog index here. |
||
|
Contact us
|
|
|
||
|
Contact
us now to find out more about our services. |
||||